3 ways to improve promotion analysis using shelf intelligence
In-store promotions have forever been used as a growth lever in the physical retail world. For manufacturers, promotions may account for as much as 25 percent of gross sales.
While it’s pretty easy to measure how much a promotion sold, it is a lot harder to clearly understand why a discount or a display worked or, even more important, why something didn’t. So, in addition to point-of-sale data, consumer goods companies are adopting new data on store conditions to fill in the gaps around performance measurement as well as develop new promotion and display strategies.
Shelf analytics can help unearth valuable insights on:
- Where are the distribution opportunities and execution gaps of my promotions?
- What is the relationship of promotions and displays to total brand share of shelf and share of sales?
- Do additional promotions or display space drive more sales?
Here are 3 simple, yet effective ways in which to improve your promotion analysis using in-store execution data.
Monitor gaps in compliance across brands and stores
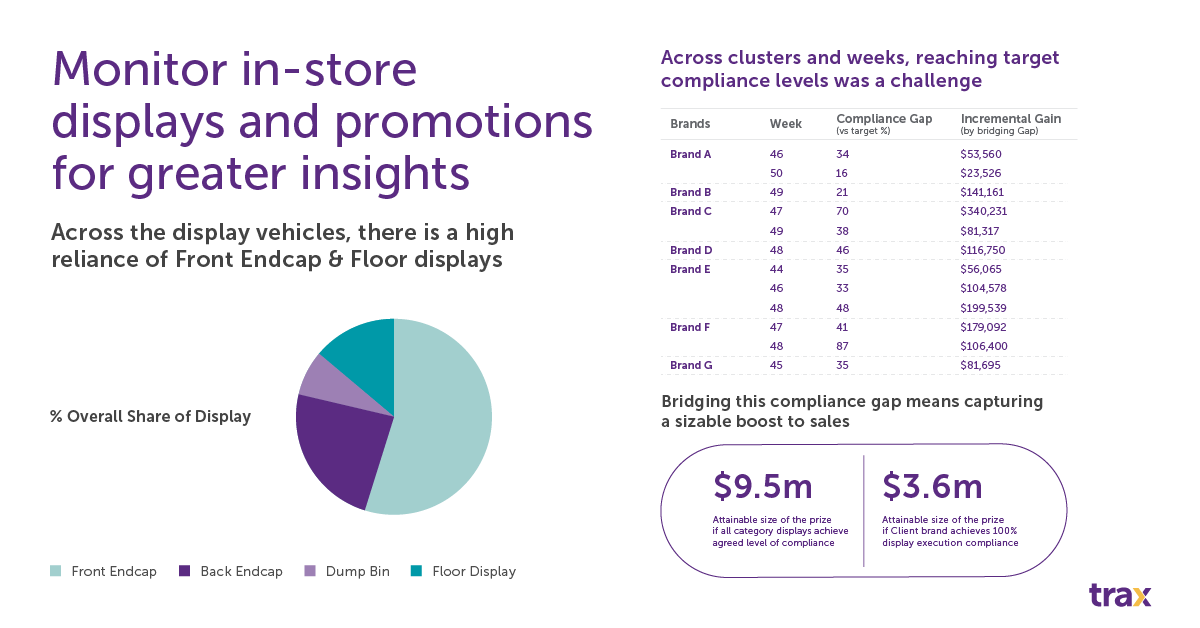
A store-level analysis by Trax and POPAI showed that 42 per cent of displays were noncompliant with the plan, but CPGs assumed compliance rates of 70 per cent or more.
Here is a real-world example of how one brand uncovered a substantial sales opportunity by closely analyzing its promotional displays.

This CPG company leveraged a customized BI dashboard to identify an astonishing 87 percent gap in display compliance versus the target execution for a core brand, Brand F. Bridging this gap alone would generate an additional $106,400 in sales. Ultimately, this client stands to gain $3.6M in revenue by closing all such execution gaps.
Analyze whether you’re using the right promotional tactic
Using the same in-store execution data, the manufacturer identified that their promotions had a high reliance on Front endcap and floor displays; Front endcap displays constituted more than half of its overall share of display.
By combining this with PoS data, they quantified the effectiveness of displays and uncovered new promotion optimization and rationalization opportunities.
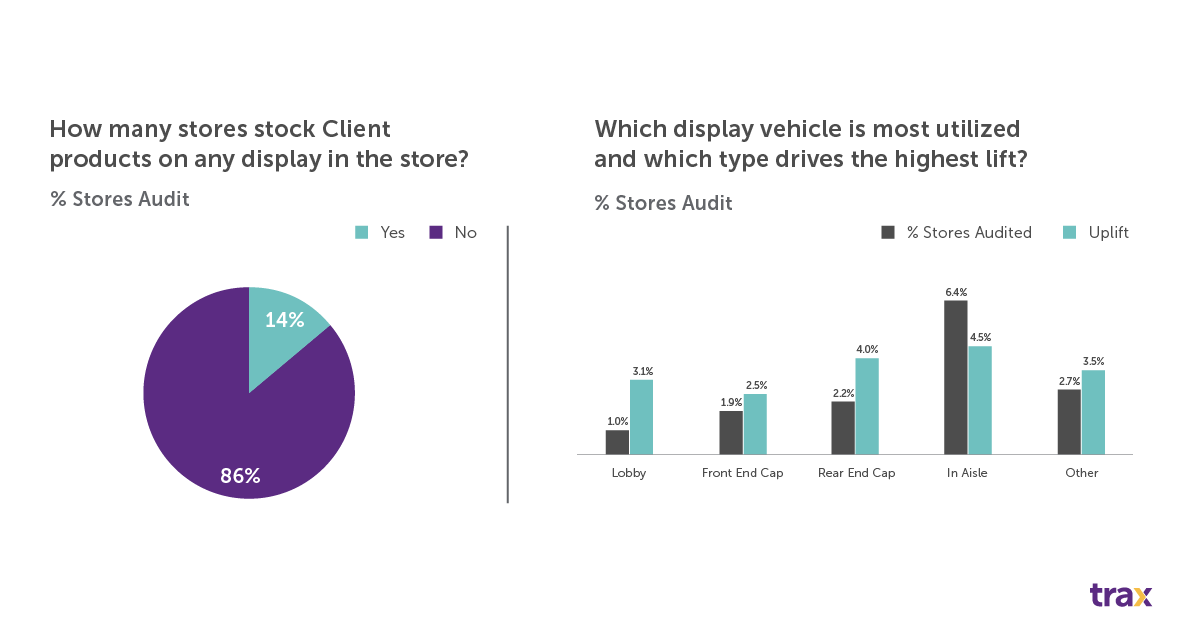
In the dashboard below, it is easy to visualize not only how many stores have the company’s products on display in the store, but also see which display type drives the highest lift. In this case, in-aisle displays drive the highest lift (4.5%) and Front End Cap the lowest lift (2.5%).

Spot competitor trends early
Having ‘eyes in the store’ on placements means going beyond getting compliance right in the store. It’s important for brands to understand their own displays, but they should aim for visibility across competitors’ promotional activity, too.
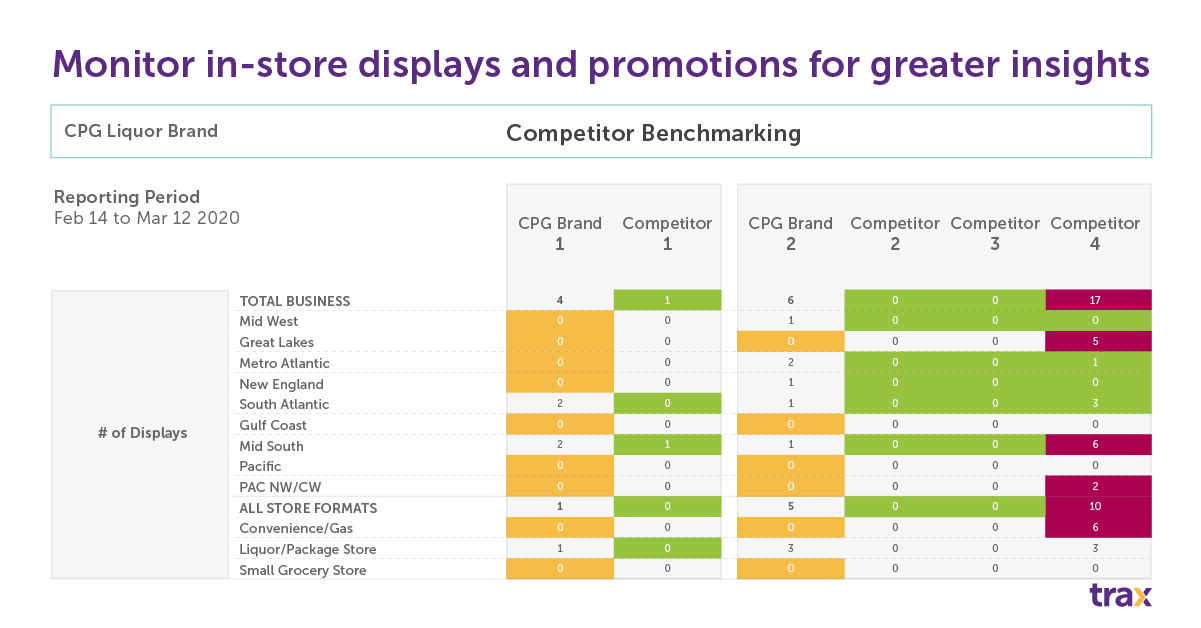
The dashboard below gives multinational alcohol manufacturer intelligence on their competitors’ core SKUs and their on-shelf presence across display type, store type, region and trade channel. It visualizes shelf presence versus that of the competition using a simple traffic light color code.
With continuous access to this data, the brewer can:
- Gain competitive intelligence on when, where and how often competitors are promoting
- Track the impact of competitor activities on sales.

Compliance metrics, such as on-shelf availability (OSA), share of shelf and shelf positioning are essential for ensuring brands are getting what they’ve paid for and identifying which corrective actions field sales teams should prioritize during store visits.
With access to granular reports that compare clusters of promotions displayed versus what competitors have on display, CPGs’ brand and category managers can create clear actionable targets for the retail outlets displaying promotions.
Trax Insights Studio provides on-demand insights and accessible data that allows CPGs to make data-backed display decisions with confidence. It turns a cumbersome analytics process into an easy, intuitive experience for infrequent users and offers unparalleled analytical insights for primary users.
Find out more about Trax Insights Studio and request a demo.


