The real value of Computer Vision in retail execution lies in translating captured images into actionable insights.
Previously we discussed factors like accuracy and completeness as being paramount to data quality when it concerns in-store data generated by Computer Vision solutions.
But how does Computer Vision actually convert in-store images into meaningful quantitative data for the retail and consumer goods industry? What are the tools and techniques in play when using pictures to understand real store conditions?
Digitization of a physical store
The key advantage of using Computer Vision for retail execution lies in its ability to generate a version of real in-store conditions far more accurately than manual audits. Because this approach is oriented towards the shelf and displays, it delivers more data on metrics like on-shelf availability and share of shelf than scanner data can.
For this to work, a holistic digitized representation of the store is required to convert the captured images into actionable insights and KPI calculations capable of driving decisions. A state-of-the-art Computer Vision platform can leverage advanced image stitching and geometric techniques to digitize physical retail.
If you ever need to take virtual walks, explore landmarks or find shops, restaurants and hotels on any street in the world, you’d be using the Google Street View feature on Google Maps. This is a feature that provides panoramic views from positions along many streets in the world. Most photography is done by car, but what’s on display is a panorama of stitched images.
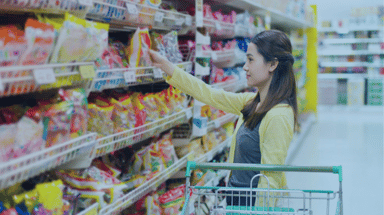
Understanding in-store conditions using Computer Vision involves capturing numerous images across hundreds of aisles each containing many products. One of the most compelling means of visualizing data of this form is via multi-perspective panoramas.
In simple terms, this process amounts to extracting individual images taken from different viewpoints and devices and then aligning them to generate the final panorama. This process of mosaicking— or stitching— involves greater computational complexity in retail than in other domains.
In a non-retail setting, for example, tracking faces in a crowd is slightly easier as there are no faces that are repeated. But in the context of a retail store, where identical products are often placed next to each other, the process of visually reconstructing the shelf while ensuring that there are no overlaps or duplicates needs a stitching engine built on advanced algorithms.
The latest innovations in store data capture also leverage augmented reality technology which informs auditors exactly what portions of the shelf were captured, thereby dramatically accelerating the stitching process.

Often, consumer goods manufacturers rely on a cluster of metrics or KPIs to understand their brand visibility, for example linear share of shelf. This metric refers to the percentage of the physical shelf length occupied by a brand in a category out of the total shelf length in inches or meters.
The Trax system uses advanced geometric techniques to account for the angle and distance from the shelf from which the photo was taken. This helps reveal the exact location of each product on the shelf, even accounting for stacked items. For example, it can pinpoint a Coca-Cola 600 mL in bay 4, shelf 2, as the fourth item from right, at the top of the stack.
But to calculate metrics like linear share of shelf, knowing individual product size is as important as its location. Tight rectangular masks are created around each product, and the exact amount of shelf space occupied is computed using deep learning algorithms that train on known dimensions of a small sample of products.

The image stitching and the geometry engines digitally recreate the entire shelf, but the data still needs to be translated into meaningful insights.
A flexible and agile KPI calculation engine works on aggregated multidimensional data points to deliver actionable insights on various store parameters like product presence, position, planogram, promotions, and pricing.
The metrics calculated provide answers to critical questions that brands and retailers may have, such as: am I getting my fair share of shelf? are my power SKUs in store? do I have the right facings? and how effective are my displays and promotions? These insights are then delivered via dashboards tailored to user roles ranging from field sales representatives to supervisors and head-office managers.
Advanced algorithms that perform panoramic stitching and geometric calculations are essential to capture store conditions accurately and translate them into actionable insights.
Contact us to learn more about our Solutions.