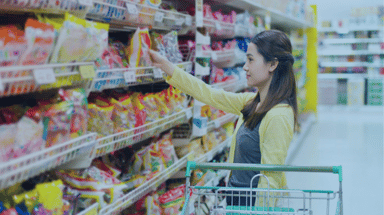
fbpx

How to optimize your category assortment using shelf data

How to optimize your category assortment using shelf data

Determining the right product assortment is crucial to retail success. The ability to interpret in-store conditions in the context of space and sales helps brands improve SKU productivity, earn better returns on space and gain retailer trust.

There are two dimensions to product assortment: product breadth and product depth. The number of different lines kept in stock determines product breadth, and product depth measures the number of units of each line.

Let’s take an example: A liquor store specializing in fine wine might stock a wide range because it knows its customers tend to seek out new and unusual products. Meanwhile, another similarly-sized store might choose to stock large quantities of the most popular beverages. The two stores have roughly equal product assortments, but one has greater product breadth and the other has greater product depth.

Why is shelf data important for assortment and space planning?

Retail space is costly. So as a consumer goods manufacturer, you want to ensure that you’re placing the most productive SKUs in the right locations, in your most important stores. Consumer goods companies often look at unit sales volume or profit to identify their best products and optimize their category assortment. Indeed, analyzing sales based on a number of characteristics, such as product type, size, color, price, or SKU, provides good insights for category planners, but it also leaves many questions unanswered:

  • Is my minimum product assortment available on shelf?
  • What is my share of space of the brand/SKU/category level within key customer segments?
  • What is the sales velocity of my SKUs across different stores?
  • Which brands and SKUs are under- or over-represented?
  • What is the assortment gain/loss over time?
  • Are competitors encroaching on my space, or am I seeing cannibalization?

Answering these questions requires shelf intelligence, and that means collecting data that is accurate, granular and current. Manual field data collection is time-consuming and error-prone, but Computer Vision technology has changed the game. Images taken from fixed cameras, field force-operated smartphones, or even autonomous robots provide ‘eyes in the store’ that brands need.

By fusing this stream of shelf data with other datasets and visualising them on intuitive, interactive dashboards, companies can optimize facings and listings, discern which products are redundant from the consumer perspective and keep products that are truly essential to a category.

Here are some real-world examples of how Trax clients derive greater intelligence and insights from shelf data.

  1. Compliance and availability

A leading global alcoholic beverage manufacturer uses a simple dashboard to visualize the availability of their must-stock products by store type and by trade channel.

Trax’s ‘ranging’ KPI reveals the number of range-compliant stores. A simple traffic light color coding scheme identifies ranging gaps and potential revenue losses by SKU when linked to electronic-point-of-sale (ePOS) data.


  1. Quality of shelf space

A classic benefit of SKU-level shelf data is to see how much of the space devoted to the category is occupied by your products. This share of shelf metric is a key indicator for any brand or category manager.

But now, manufacturers can go further to evaluate the quality of space occupied by their brands and products. Comparing the share of space at an individual brand or SKU level with its sales contribution helps in understanding whether brands achieve their fair share of space.

A leading FMCG company discovered the biggest threat to its shelf space was from retailers’ private label products rather than traditional rivals. Comparing the number of facings with sales generated revealed the company’s products had less than their fair share of space. Negotiations with retailers based on these facts helped gain a fair share of space, which ultimately increased sales by 10.8 percent.

This visibility of fair share assists in negotiations with retailers, optimizes space utilization and improves sales.

  1. Impact of a category reset

As a manufacturer, you know it’s time for a dialogue with your key customer when:

  • shelf resets change your space and your contribution to category growth, or
  • companies with less effective shelf space allocation methods gain more than their fair share of space

A timely, granular view of ‘shelf reality’ allows careful evaluation of the impact of a reset on your brands and product portfolio. Trax quickly provides objective, accurate shelf data along with photographic evidence of in-store conditions, enabling an effective dialogue with your key accounts to achieve in-cycle changes.

Next-generation analytics is needed for accurate and timely shelf insights 

Trax by Design is our next-generation analytics suite, delivering shelf insights on demand and at scale to consumer packaged goods manufacturers and retailers. Our dashboards and reports promote a better understanding of in-store execution and how it impacts your business.

Interested in exploring the science and art of next-generation analytics? Book a chat with us today.

Back to top