
It’s an accepted fact that about 2/3 of shoppers only decide what product to buy when they are in-store at the fixture. Ensuring that the category fixture is “easy to shop” and having your products and brands in the right place is only part of the story. What about getting the right amount of space for your products and your brands and securing the shelf position that helps them stand out among competitors?
For many Consumer Packaged Goods (CPGs) companies maintaining or growing market share is an important measure of success. Increasing distribution in different channels certainly helps but can also have diminishing returns as not all stores are equal. Another lever available to drive sales and market share is to increase the space allocated to a product or brand in-store. Retail space is not elastic and normally comes with a price too in terms of listing or insertion fees, so knowing how much space is optimal for your products and brands will provide competitive advantage and help ensure trade spend is optimized. A great starting point is to analyze share of shelf at a store and retailer banner level. Share of Shelf is like market share but is based on space allocation rather than retail sales performance.
How is Share of Shelf (SOS) calculated?
Typically, SOS is calculated in two ways:
Audit techniques employed by sales reps or third party brokers are largely manual and labor-intensive. By their nature manual audits can be inaccurate, subjective and incomplete. By the time the data is collected and analyzed, it will likely be out of date. Typically teams such as category management, revenue management or trade/channel marketing have limited visibility to this data.
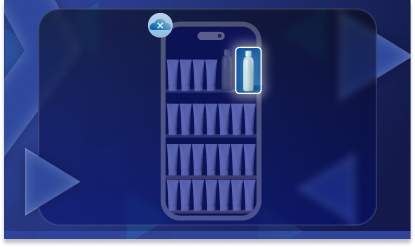
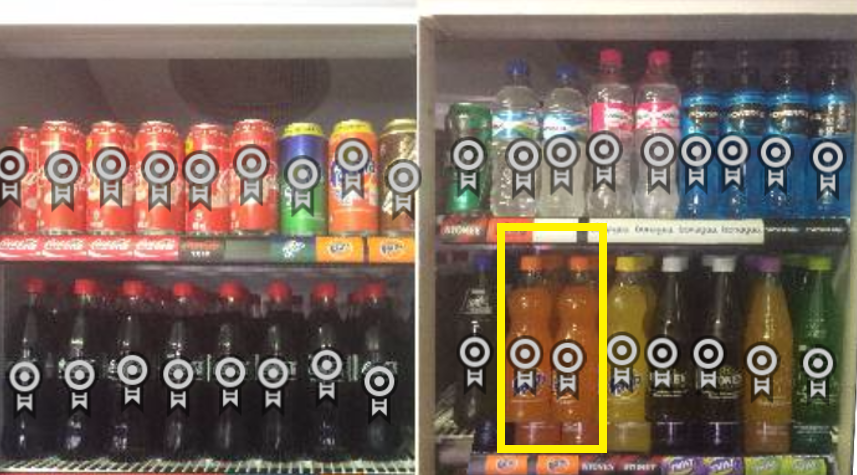
Many CPG companies and distributors are turning to Computer Vision technology to automate and digitize in-store execution. Offering the ability to recognize every single SKU on the shelf and identify its location using sophisticated geometric techniques, these advanced systems provide the most reliable way to measure share of shelf.
Every SKU tagged: Illustration of shelf image analyzed by Computer Vision
Accurate, timely data on share of shelf is of immense value to manufacturers. For example, in the ambient aisle it enables you to identify stores in which your brands have low shelf share compared to competition. In chilled aisles, where you may have branded coolers and chiller cabinets it enables you to determine if competitors or indeed other product categories are encroaching on the space you paid for. Where you are running price promotions without additional off-shelf displays it provides insight into the ability of the shelf to cope with incremental sales demand.
But how valuable would it be to take things a step further and combine SOS with sales data? Here are three ways in which you can leverage a simple integrated data set like this to build your category strategy.
One of the foremost advantages of combining Share of Shelf (SOS) and EPoS data (electronic point of sales) is that it allows you to investigate whether your brand, and your competitor brands are getting their fair share of shelf space compared to the contribution they make to category sales. This allows you to pinpoint products and brands that are under-spaced or over-spaced and therefore may be drivers or drainers of category growth.
Products and brands that are overperforming vs. their sales contribution (i.e. SoS is lower than market share) might be able to deliver increased sales if allocated more space at shelf. Conversely, underperforming items may not be able to justify their allocation, presenting valuable opportunities to grow your SOS at the expense of a competitor.
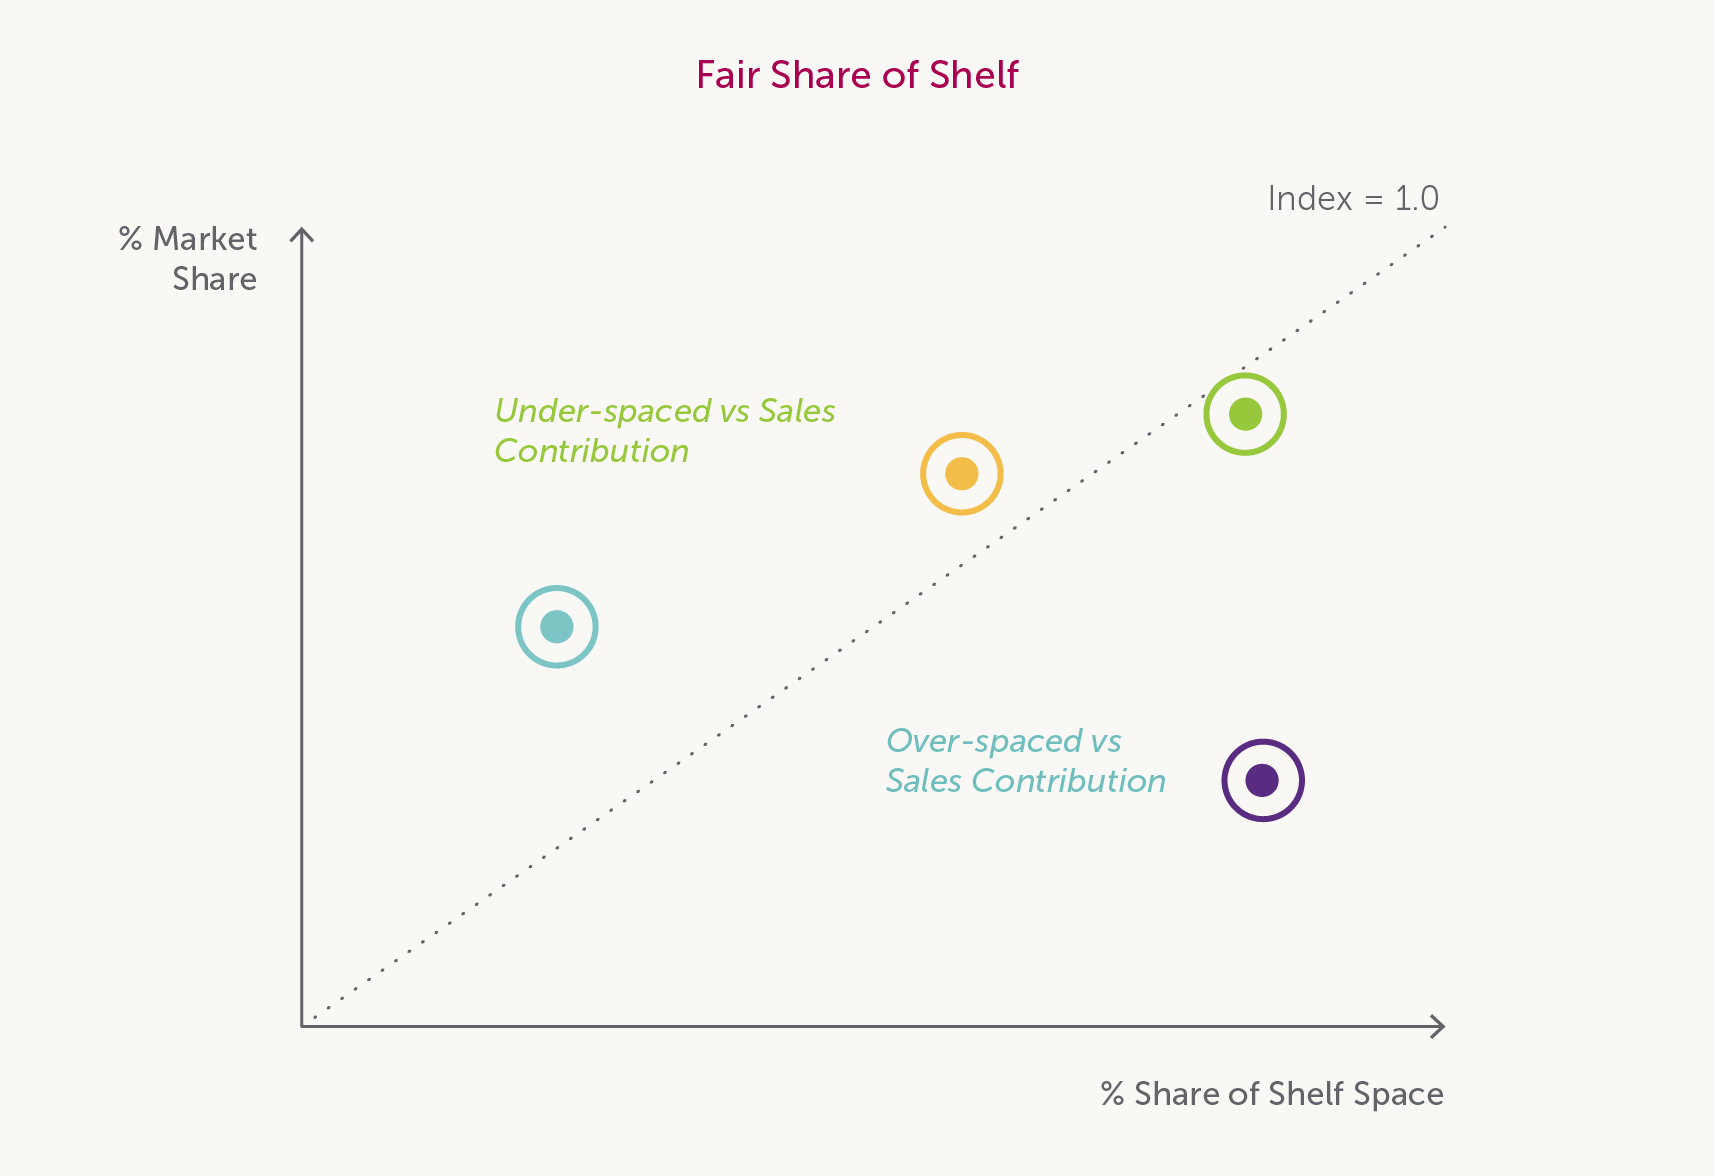
By looking at fair share trends over time, brands can uncover important category trends and gain insights into sales velocity. If under-spaced, could the item be slower-selling? Or is it simply a bulkier item that naturally occupies the bottom shelf? If over-spaced, is the item a challenger brand or a new segment (i.e. craft beer)?
Understanding fair share of shelf helps brand owners, distributors and retailers both before and after range reviews and resets, ensuring that shoppers always see the right products in the right quantity. Leading manufacturers use Trax data to optimize shelf space for products and brands based on the sensitivity of their sales to space.
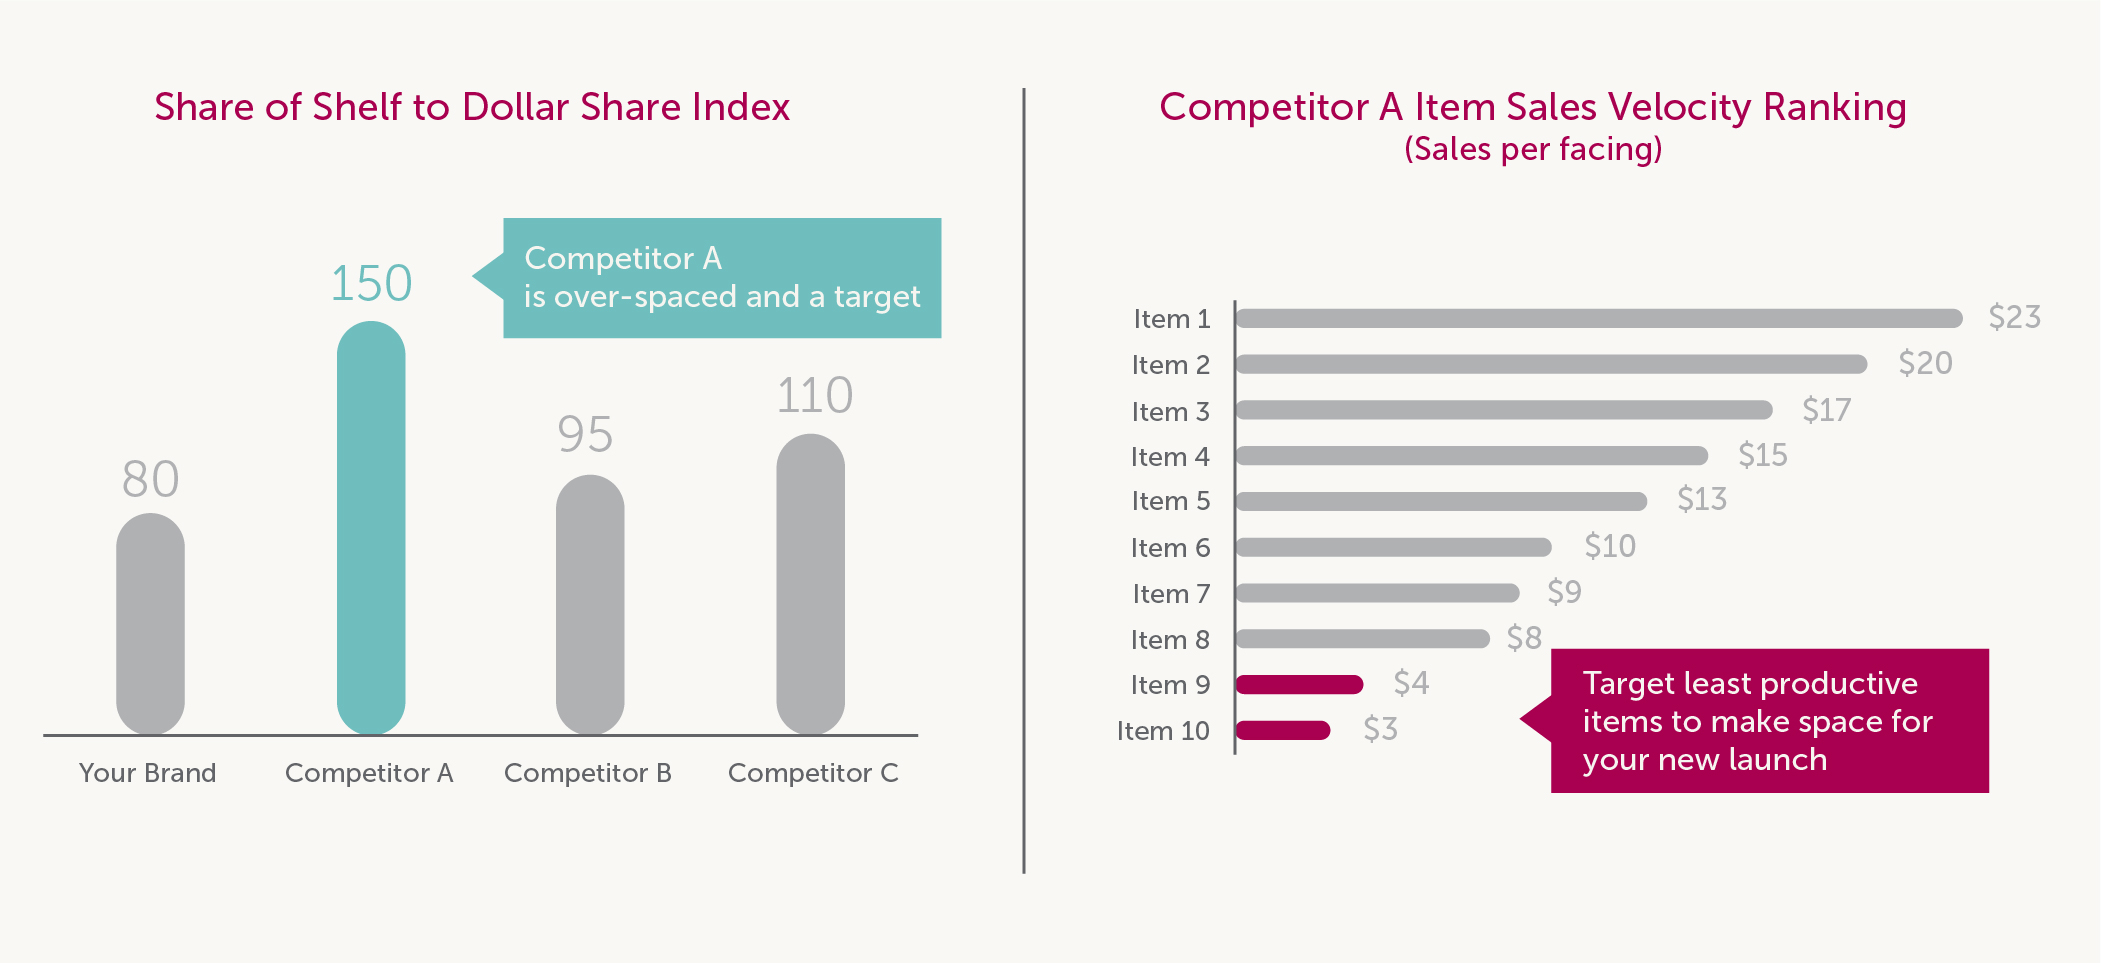
Manufacturers wanting to introduce a new product often face a “one in, one out” challenge. The risk of cannibalizing your brand of products is ever-present unless you have the data to make a compelling argument for taking space from a competitor and using it for your launch. At the least, you’d want to ensure that reducing the number of facings of some of your own products would create space for NPD without a significant reduction in sales of your own portfolio.
As an example, Trax worked with a CPG client seeking additional shelf space during the critical first 12 weeks of its launch phase. A fair share of space to sales analysis allowed the client to see which competitor items were over-spaced and therefore underperforming, enabling them to open up a meaningful dialogue with their retail partners. More importantly, with data on sales and facings for every SKU ranged, they were able to pinpoint the least productive items on the shelf – and convince the retailer to make way for a new product.
In addition to being able to track the speed of launch at store level, with real-time share of shelf and EPoS data, CPG companies can verify that a new product launch was successful in terms of execution and incremental sales contribution.
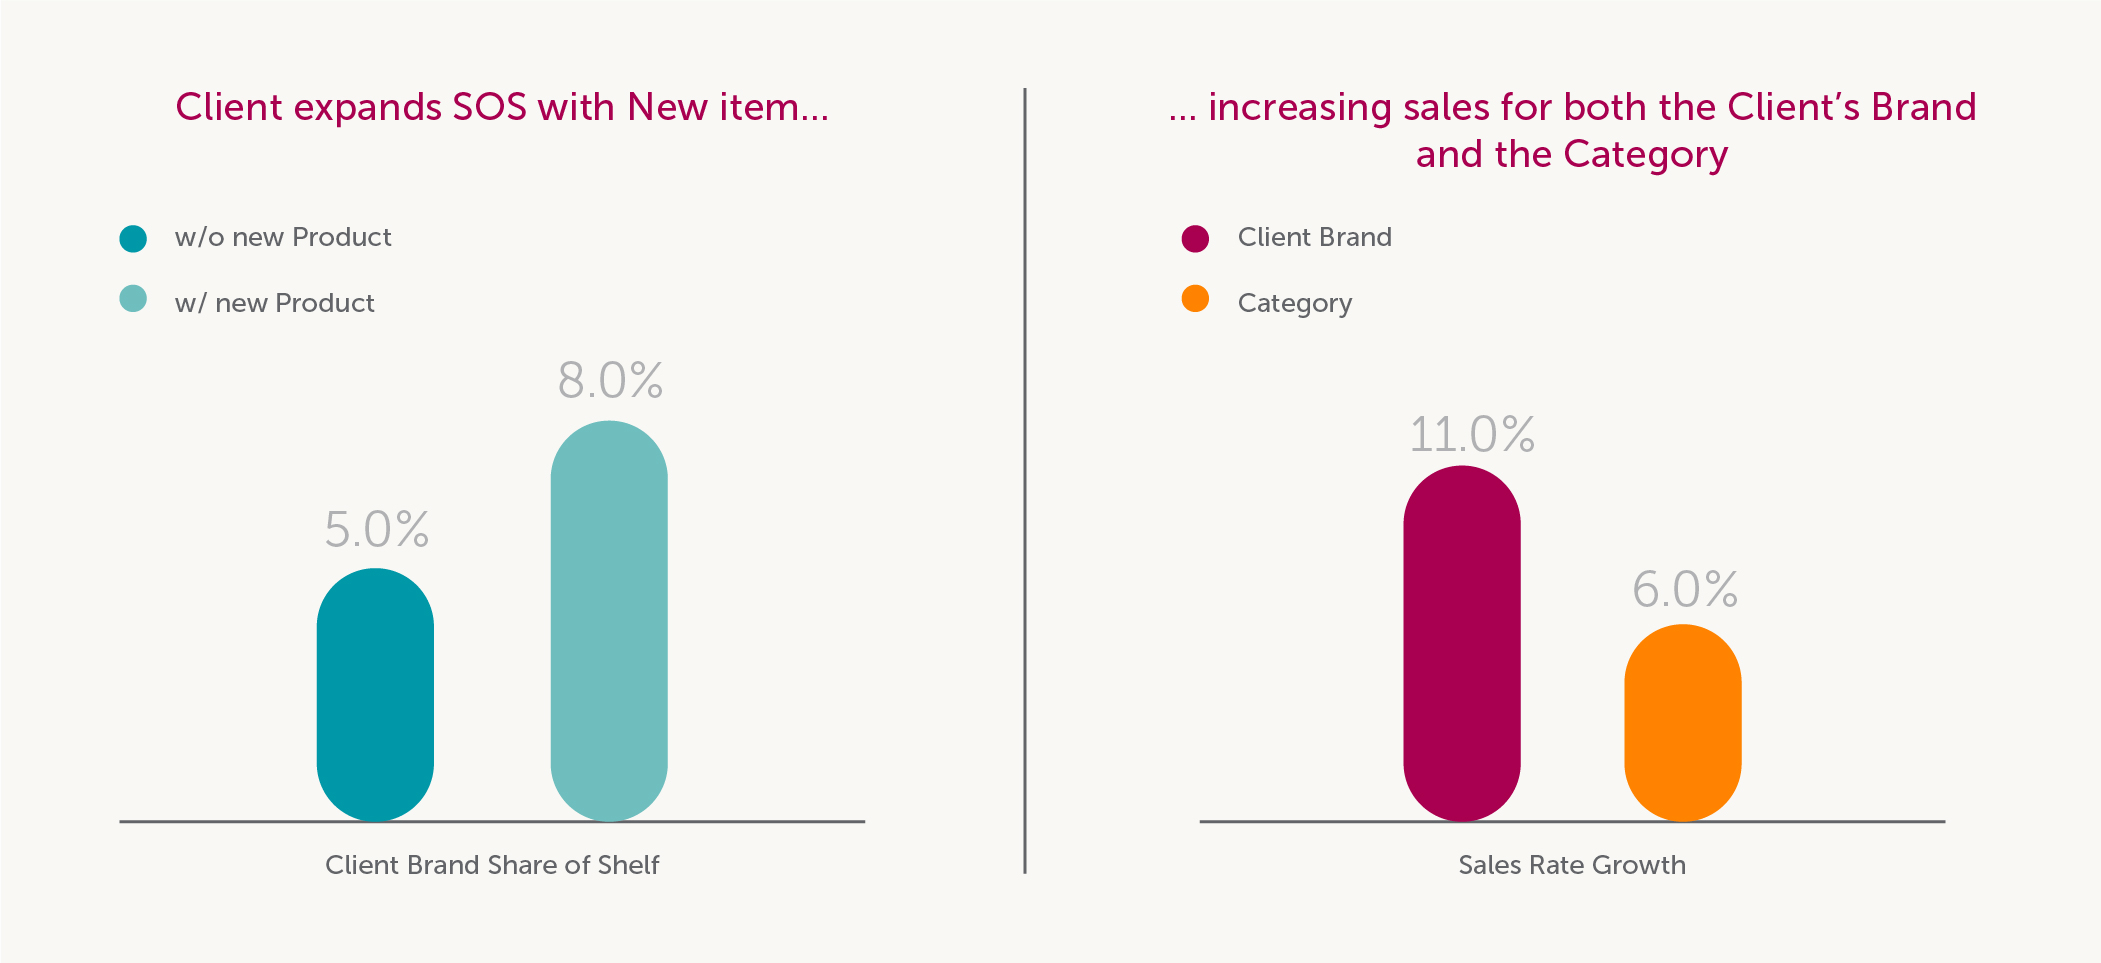
More pertinently, the data reveals how an optimized portfolio could drive sales, or what extra percentage point of market share could return incremental sales. This kind of granular store level detail allows you to engage in meaningful conversations at a strategic level with your retail partners.
What’s next?
Whether you’re a category captain or a challenger brand, combining shelf data with sales and inventory data provides actionable answers to burning questions: Why are shelf gaps occurring? What is the cost-benefit of optimizing space?
Watch this free webinar to learn how to integrate Trax data into your decision making in four simple stages.