More than 50 percent of stockouts are the result of inefficient store practices like replenishment, store ordering and forecasting rather than upstream supply chain issues.
Existing in-store inventory measurement methods have failed to keep pace with the fast moving retail landscape. With the industry currently struggling with a high out-of-stock (OOS) rate of eight percent, addressing this issue requires innovative technologies that offer a closer, more granular look at on-shelf availability (OSA) to prevent lost sales.
AI and machine learning technology is digitizing the retail store, which means brands and retailers can track what’s happening to every SKU in every store in near real time. Converting actual shelf images into insights, this new breed of shelf data can increase inventory management and perfect in-store execution.
By identifying patterns in customer demand and store stock levels that occur as a prelude to or in the aftermath of stock-out scenarios, Trax data can help maximize product performance at shelf. Here are 3 simple ways in which you can approach your OSA problems using Trax and avoid potential disruptions ahead of being back in stock:
A store in a residential location may face peak hours on weekends, but a downtown store close to office buildings may have most customers walking in during lunch hours on weekdays. As a result, each story optimizes slightly differently due to flow fluctuations like this.
Demand forecasting and trends vary across store types, as do product assortments. Neither scanner data nor manual auditing methods offer store-specific data at the individual SKU-level, making it difficult to firstly identify what’s out of stock, and secondly, to resolve issues. Trax can provide a way to streamline these issues, as well as improve operational efficiency and real-time inventory, without risk of OOS or for that matter, overstocking also.
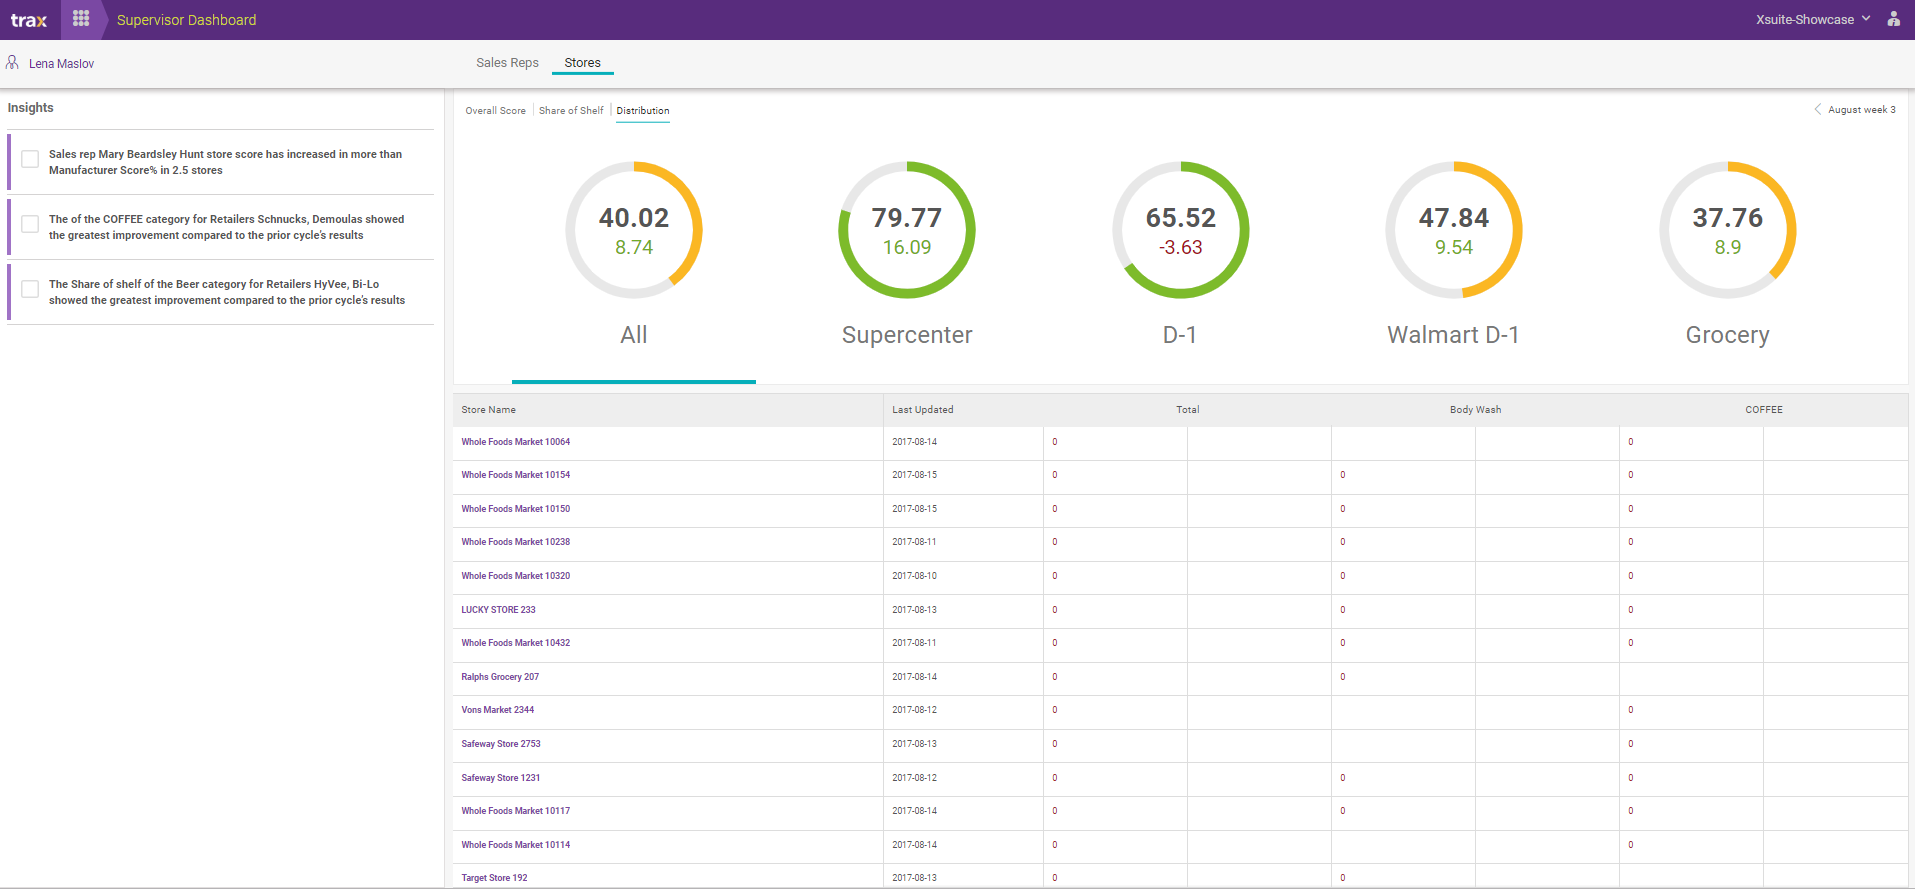
With Trax Retail Execution, sales supervisors can access a console (Fig. 1) to track out of stocks and on-shelf availability at a store, category or SKU level. Alerts let you know if OSA dips below a certain threshold, so you can take quick action. For example, you can set up an alert if the OSA of your hair care category falls below 60 percent in more than 30 percent of your individual outlets. Or if your 330 ML beverage product is out of stock in more than more than 15 of your key discount retail stores.
Fig. 1: Supervisor Console in Trax Retail Execution
Some SKUs tend to be out of stock more often than others. This can be due to high demand for particular SKUs or promotions spurring more demand than expected. But it can also signal underlying problems, such as inaccurate shelf tagging or misplacement. For this reason, it’s important to isolate SKUs with frequent OOS issues to prioritize their shelf availability. Demand planning is a key part of effective inventory management and helps with potential bottleneck issues like seasonality.
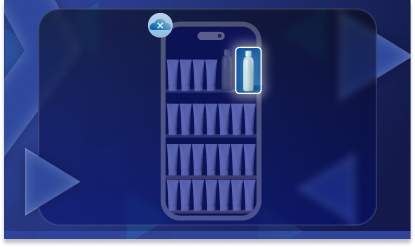
Trax’s solution can help with this. Despite multiple SKUs and nearly identical product facings, Trax can differentiate between products with a high degree of accuracy – tracking SKUs with obscure packaging under poor lighting conditions and detecting newer product versions for example, meaning not just inventory levels are reviewed but the right products show at the right time, while avoiding any potential shortages that may cause a reduction in customer orders / sales.
Fig. 2: SKU-level availability tracking

A sample of Trax data (Fig 2) shows the OSA (On Shelf Availability) of nine products under the Hero range across six stores. Here, Store A is the worst performing, with metrics noting six products unavailable at the time of audit. Products 1, 4 and 7 require attention, as they are unavailable in three stores, which can impact customer expectations. By comparing OSA levels across stores and SKUs over time, manufacturers can identify patterns of movement and pinpoint repeat offenders with an inventory management system.
Now that you know which your problem stores with low availability issues are, you can also start to uncover how your products perform against competitors. Decision making based on profitability and performance vs competitors are just some of the additional insights you can find with Trax.
For example, a client used Trax sales data to analyze the performance of its tea category products against that of its competitors. The client narrowed down stores with lower availability rates and then dissected the problem by comparing its OSA rates against those of competitors, not just at a store level but across different shelf placements and locations (Fig 3).
Fig. 3: OSA benchmarking chart
Fig. 3: OSA benchmarking chart
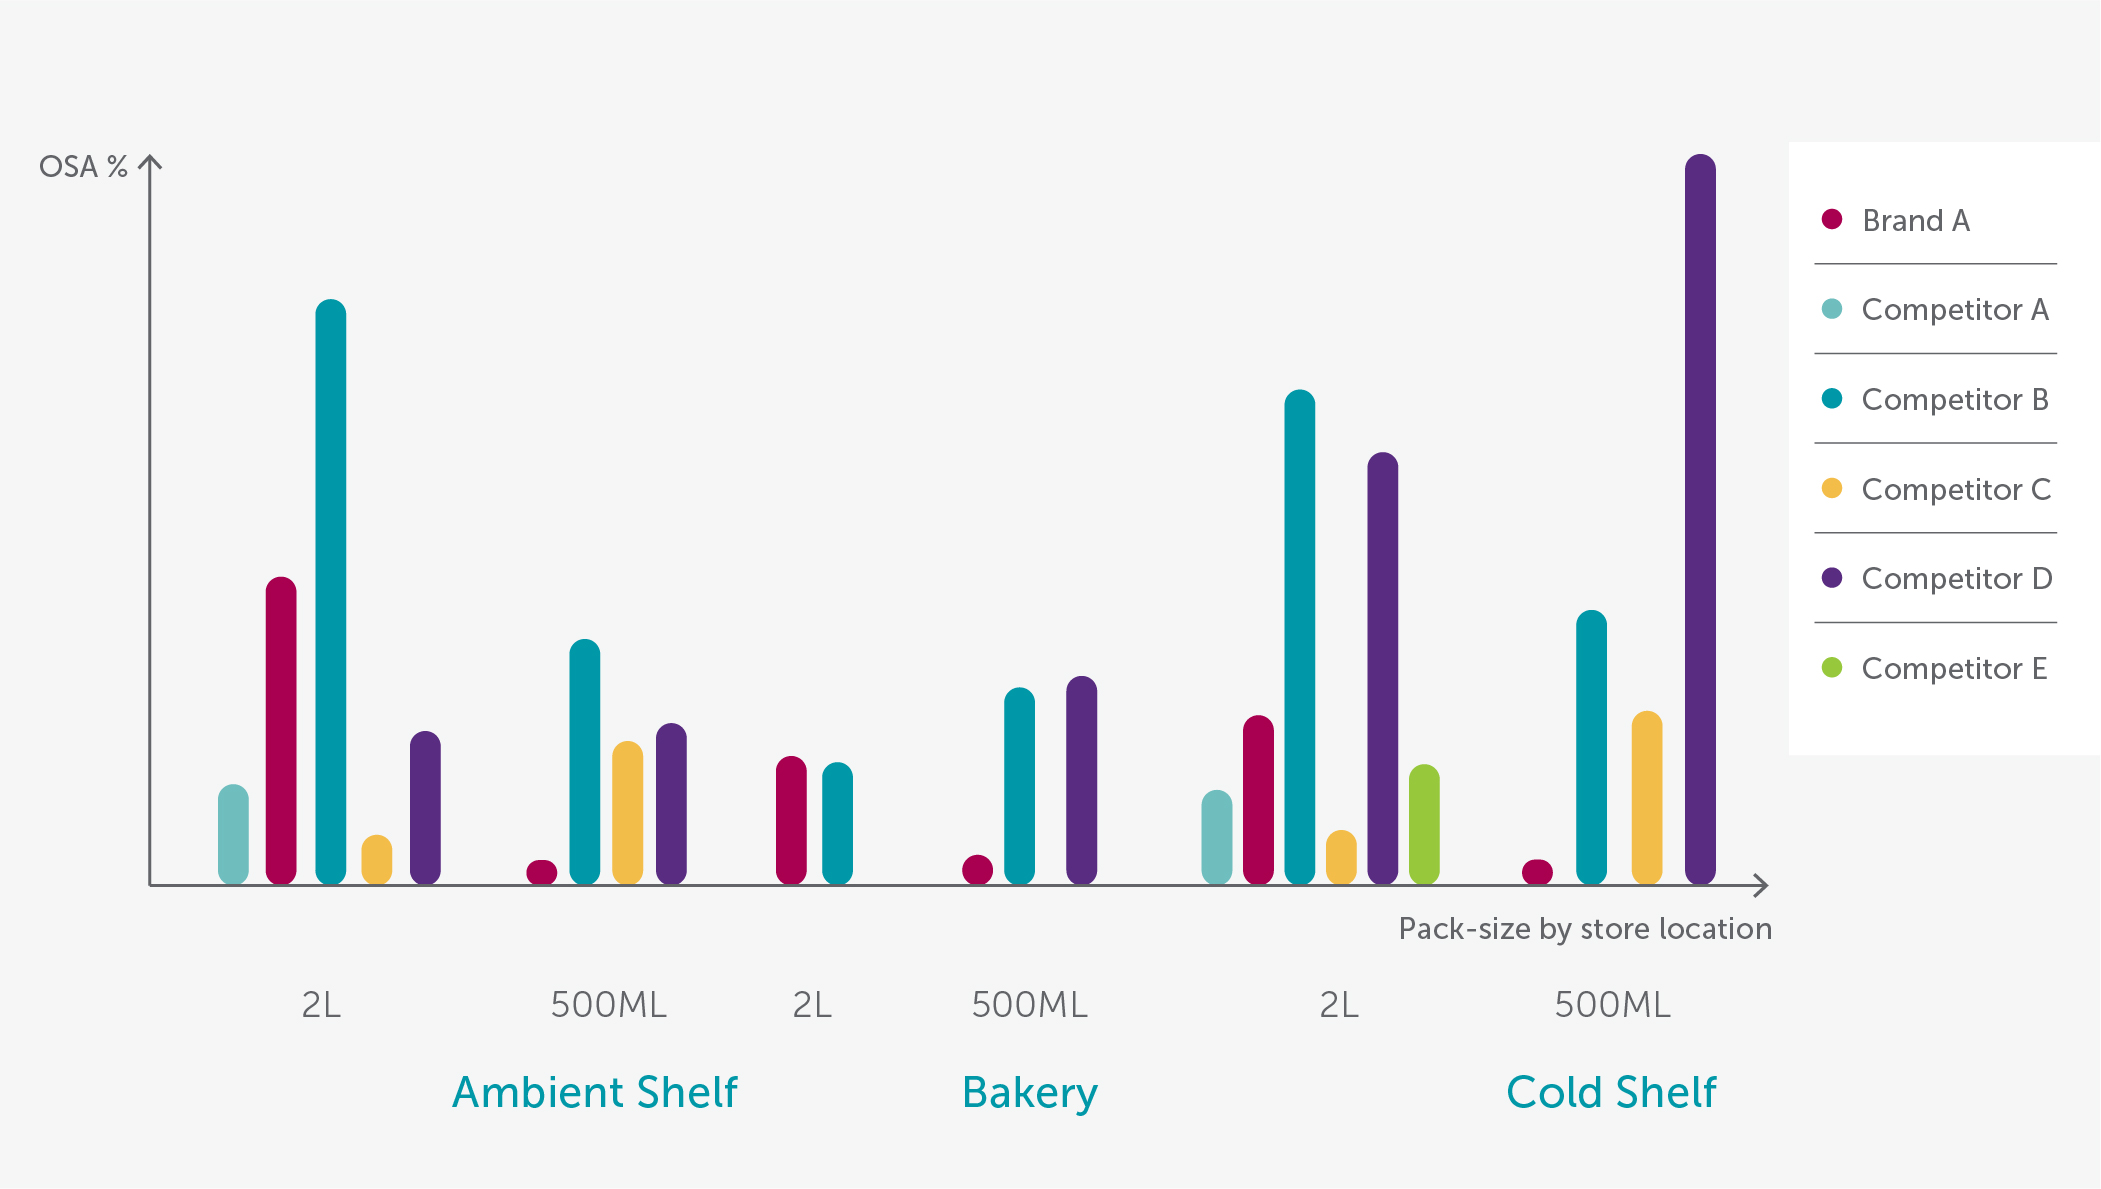
The benchmarking study revealed merchandising gaps, particularly in the 500ml category. Further, the exercise revealed that competitors provided smaller packs in cold shelves for shoppers to consume immediately. With a clear view of targeted actions to take, the client was able to improve availability where it matters most and also reduce the cost of execution.
In an era in which fragile brand loyalties can lead to high opportunity costs, cutting-edge technology is critical for managing product availability. Collecting real-time data from the field and translating these valuable insights and data into informed decisions can be a real game changer.