Home / Insights /
How do you know how many of each product to put on your store’s shelves? Does a product sell well because it has pride of place, or would it sell well wherever you position it? These questions have been plaguing store owners and CPGs (consumer packaged goods) companies for years. But now there’s a way to answer them.
Deciding how many of each product to place on which shelf is one of the biggest decisions facing retail store managers. The placement and distribution of a brand’s SKUs (stock keeping units) can determine whether a product sinks or swims. So it’s no surprise that manufacturers spend considerable money and resources to secure the prime spots. According to a recent report by the University of Chicago, store occupancy costs range from $20/square foot for dry grocery shelf space to $70/square foot for frozen goods — that latter figure is about the same as real estate property in Mobile, Alabama.
It’s a delicate balancing act. Allocating too many facings will be a waste of space, while too few will mean out of stocks, and hence lost sales. Space elasticity of demand is complex because there are many variables to consider: not only the quantity of space allocated to the product, but also the quality of that space (incorporating the store location, shelf height, adjacency to other products, etc.). These all influence demand.
Thankfully, data science is shedding new light on the concept, giving CPGs and retailers greater insights into the optimum positioning for different products.
Elastic fantastic: Data science, EPOS and finding the inflection point
CPGs and retailers are under more pressure than ever — established brands are under fire from an influx of ‘craft’ newcomers, while big box retailers face a challenge from discount stores. Hence, it’s more important than ever that CPGs and retailers work together to maximize return on space. This is where data science comes in.
Using new image recognition and artificial intelligence technology, both can collect masses of shelf data (like product placement, shelf share etc.) and combine this with EPOS (electronic point of sale) data. Thanks to state-of-the-art data mining techniques driven by sophisticated algorithms, this raw data can then be utilized to measure, map and utilize space elasticity and improve returns on space.
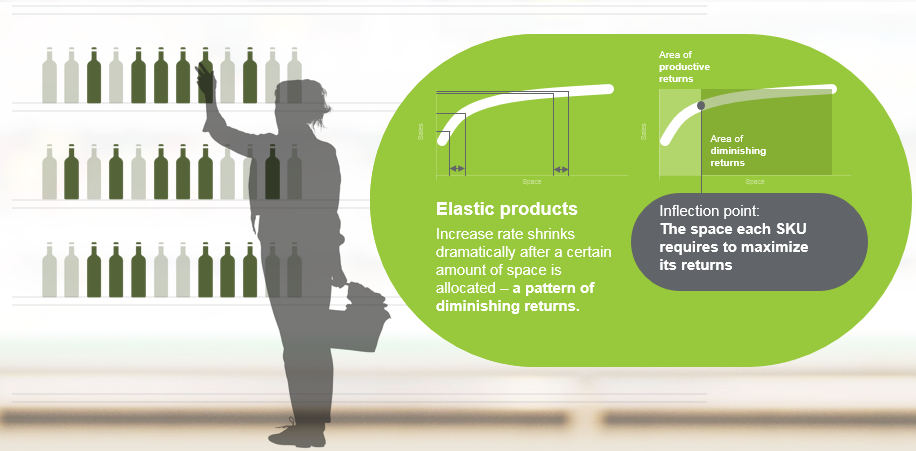
The key is to find each product’s ‘inflection point’ — this is the point where increased shelf space has a diminishing return on sales. Say a shelf with 10 facings of packs of potato chips generates 10 per cent additional revenue with every additional facing on the shelf. But the rate of revenue increase drops to 2 per cent beyond the fifth additional facing, and to 1 per cent beyond the 12th. The inflection point would be 15 facings, when sales increase by 50 per cent.

Once retailers and CPGs know this, they can identify which products are below their inflection point and which are above. They can then re-allocate shelf space accordingly to maximize return.
It might seem like a small change, but it can make a big difference to your bottom line. A leading retailer in Australia worked together with the CPG category leader in the salty snack category, to identify 48 SKUs which were below their inflection point. If these SKUs were together given 22 per cent more space, sales would increase by $61 million a year. Conversely, 87 SKUs had more space than they needed, and that would be better used by other products. Deallocating this space cost $23 million a year, providing a net sales opportunity of $38 million. Which would make a big difference to any company.
Making space for change: Giving yourself the best chance of success
Space elasticity is a complex problem. With so many factors, both internal and external, it’s impossible to ever really know what the impact of all these variables is. But big data and consultative analytics is enabling CPGs and retailers make shelf space work harder.
To find out how our retail advisory partners can help, click here.
Give us some info so the right person can get back to you.